Posts

How is the resistance level for a particular stock on the stock market, or for the index as a whole determined?

Image
Generally people say resistance is at a point. It is an area. The area or price range where a stock gets selling supply or faces resistance from further rising, is the resistance. Take Apple AAPL for instance. Stock resistance level was around 102 to 104 where it was getting strong resistance. Now it has crossed the resistance, and quoting at 105. If you are from India, see the chart for State bank of india SBIN , where the stock is facing strong resistance in 2600 to 2650 area. Today, it is likely to close around that level having hit 2655 or so.

What is the best way to earn money in the stock market?

Image
My uncle purchased Maruti Suzuki 800 in the year 1998. I asked him: “Why did you purchase Maruti in 1998?” “Becuase it was the best entry segment car in India and had a great market report. The cost was reasonable, the mileage was great and the customer service was fantastic.” In 2003, Maruti Suzuki has an IPO. The stock rose from the level of 160 in 2003 to 7500 in 2018–19. If he had also invested the same amount in buying the stock, with 40+ times return, Rs 2 lakh would have been valued Rs 80+ lakh. My brother in law is a distributor of Shree Cement company. They have taken the distributorship in 2008. I asked him: “Why did you take Shree Cement distributorship?” “Their product quality was good and they were one of the fastest growing companies. The management was dynamic and the sales and marketing team was impressive.” After the recession in 2008, Shree Cement stock was trading at the level of Rs 300–400. In 2018–19, it is trading at the level of 16000–17000. If he had also invest...

What is a "pump and dump" scheme?

Image
Let first simply it In launguage of stock market Pump- Boosting it artificially Dump- Throw back down to its original In stock market it is generally seen in case of penny stocks (Because they are easy to pump and dump) with very weak financials. Let see it with a perfect example. Have a look at the chart below STOCK NAME: Elegant Floriculture Now look at its profits Here you can clearly see that the company is making Loses repeatedly. So it is considerable that without profits it's financials would also be weak. So you can easily understand how this stocks is artificially pumped and after that it dumped sharply. So this scheme is all about to trap simple retailers who does not have much idea about the market. Keep aware of these schemes. Hope you like it

What are the best candlestick chart patterns that we should learn to start our intraday or day trading?

Image
There is lot of candlestick you have to learn before investing huge amount some are Do some research on candlestick study constantly and correctly. Thank you

what platform has the best stock charts for beginners

Image
I will recommend trading view for beginners because Simple for beginners and effective for technical analysis experts, TradingView has all of the instruments for publication and the viewing of trading ideas

What is risk management in stock market

Image
Risk management helps cut down losses. It can also help protect traders' accounts from losing all of its money. The risk occurs when traders suffer losses. If the risk can be managed, traders can open themselves up to making money in the market 

What is balance sheet in stock market

Image
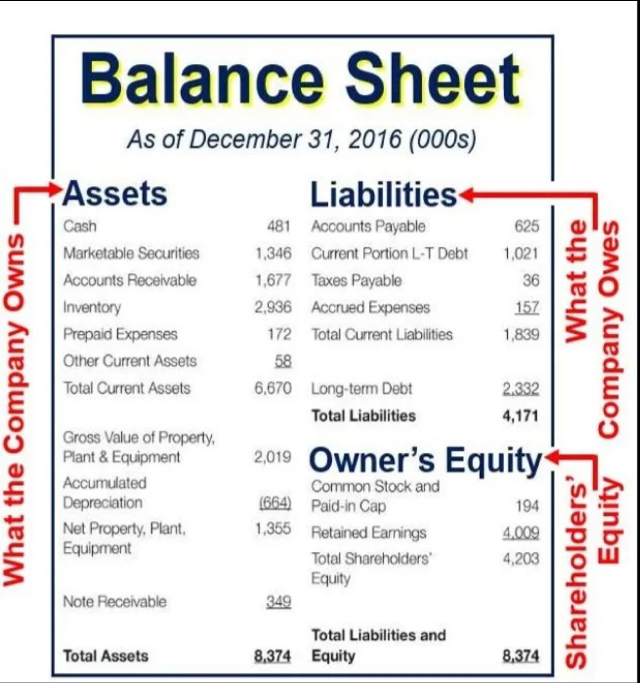
Assets = liabilities + equity  At the end of the company’s reporting period, a snapshot is taken of the company’s financial health. A balance sheet allows owners to get a glimpse into the company’s financial standings. The balance sheet is one of the three primary financial statements that business owners use. It allows owners to get a glimpse into the company’s financial standings and see what the company’s financial position is. It shows what assets are owned, which liabilities are outstanding, and any equity that has been made. Assets  Assets are the things companies own and are categorized into two categories; current and non-current assets. Current assets are defined as cash and any other asset that will be turning into cash within the company’s operating cycle. Assets are the top part of the balance sheet and will be listed in the order of liquidity. Liquidity meaning that this item can be turning into cash quickly. An example of what order current assets wou...